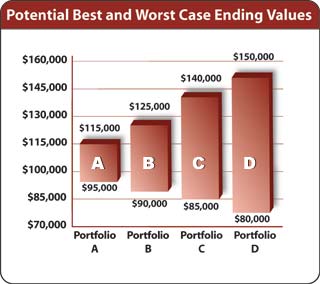
4. At the beginning of the year, you have $100,000 invested. The graph on the right shows the performance of four different hypothetical portfolios. Each bar gives the range of potential returns at the end of one year. Choose the one you feel most comfortable with.
Portfolio A
Portfolio B
Portfolio C
Portfolio D
|
|